We use cookies to improve your experience and to help us understand how our website is used. You can choose to accept all cookies or manage your settings. For more information please see our Privacy and Cookie Policy.
You can control which types of cookies you allow. Necessary cookies always run because they help the website function.
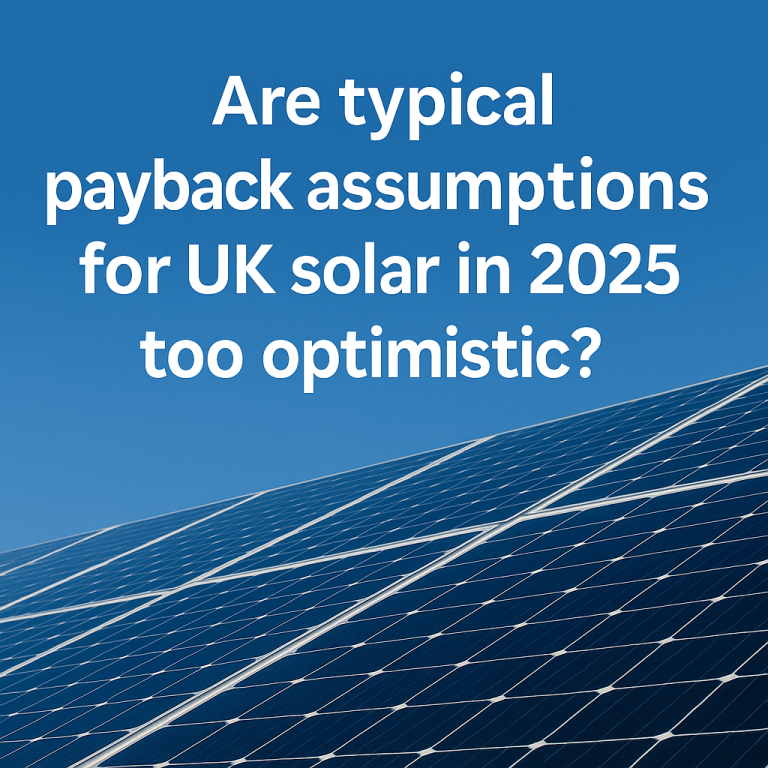
Typical payback claims still sit around six to eight years. Those figures do not tell the full story. Your return in 2025 depends on how much solar power you use at home, how export is valued under the Smart Export Guarantee and whether you add battery storage. This guide explains the moving parts and shows a realistic range.
Energy remains a major monthly cost for most homes. Solar is one of the few upgrades that can cut that cost from day one. Payback is the time it takes for savings and export income to cover the installation cost. In 2025 that figure is shaped by tariffs, battery pricing, system size and how your family uses power across the day.
A neat seven year payback often assumes year round full output and high self use. It also assumes flat price inflation for grid power. Real homes do not follow that curve. A transparent projection builds in seasonal change, realistic shading and modest performance loss.
On these numbers a straightforward system pays back in about eight to eleven years. Results move with household routines and tariff choices.
A battery raises self consumption and can reduce imports in the evening. It also adds cost. A typical battery adds about £2,500 to £4,000. In many homes that sets payback around nine to twelve years. It is still attractive if you value resilience and control. The case improves when you time discharge into stronger evening export rates.
Under the Smart Export Guarantee each supplier sets export rates. These are fixed or dynamic. Fixed export is often around ten to fifteen pence per kWh. Dynamic export can spike to twenty to thirty pence during short peaks. If you export 1,800 kWh at fifteen pence you earn about £270 a year. At twenty five pence you could earn about £450. To qualify you need an MCS certified system and half hourly export metering.
| Household type | System | Battery | Annual saving | Payback |
|---|---|---|---|---|
| Small semi | 3.6 kWp | No | About £650 | About 8.5 years |
| Family home | 5 kWp | 5 kWh | About £900 | About 10 years |
| High use home | 6 kWp | 10 kWh with dynamic export | About £1,200 | About 8 years |
Figures are indicative. Your own outcome depends on roof yield, usage pattern, tariff choice and system cost.
Many systems have repaid their embodied carbon by year twelve. Panels can keep producing for twenty years or more with modest loss.
If your result sits between eight and eleven years you are in line with the UK average for 2025. You can then test if a battery improves the picture for your routine.
Some estimates assume perfect sunshine, flat tariffs and no winter drop in output. Realistic modelling uses seasonal performance and household consumption. These factors often extend payback by a few years.
A battery improves self consumption and reduces grid reliance. It also adds an upfront cost. Whether it shortens payback depends on your tariff, usage pattern and how well the system is sized for your property.
Not always. Higher import prices improve savings on the electricity you use. Export prices may not increase at the same rate. The best returns come from matching system size and battery capacity to your usage.